
Clustering is a powerful tool in data analysis and machine learning (ML), offering a way to uncover patterns and insights in raw data. This guide explores how clustering works, the algorithms that drive it, its diverse real-world applications, and its key advantages and challenges.
Table of contents
- What is clustering in machine learning?
- How does clustering work?
- Clustering algorithms
- Real-world applications of clustering
- Advantages of clustering
- Challenges in clustering
What is clustering in machine learning?
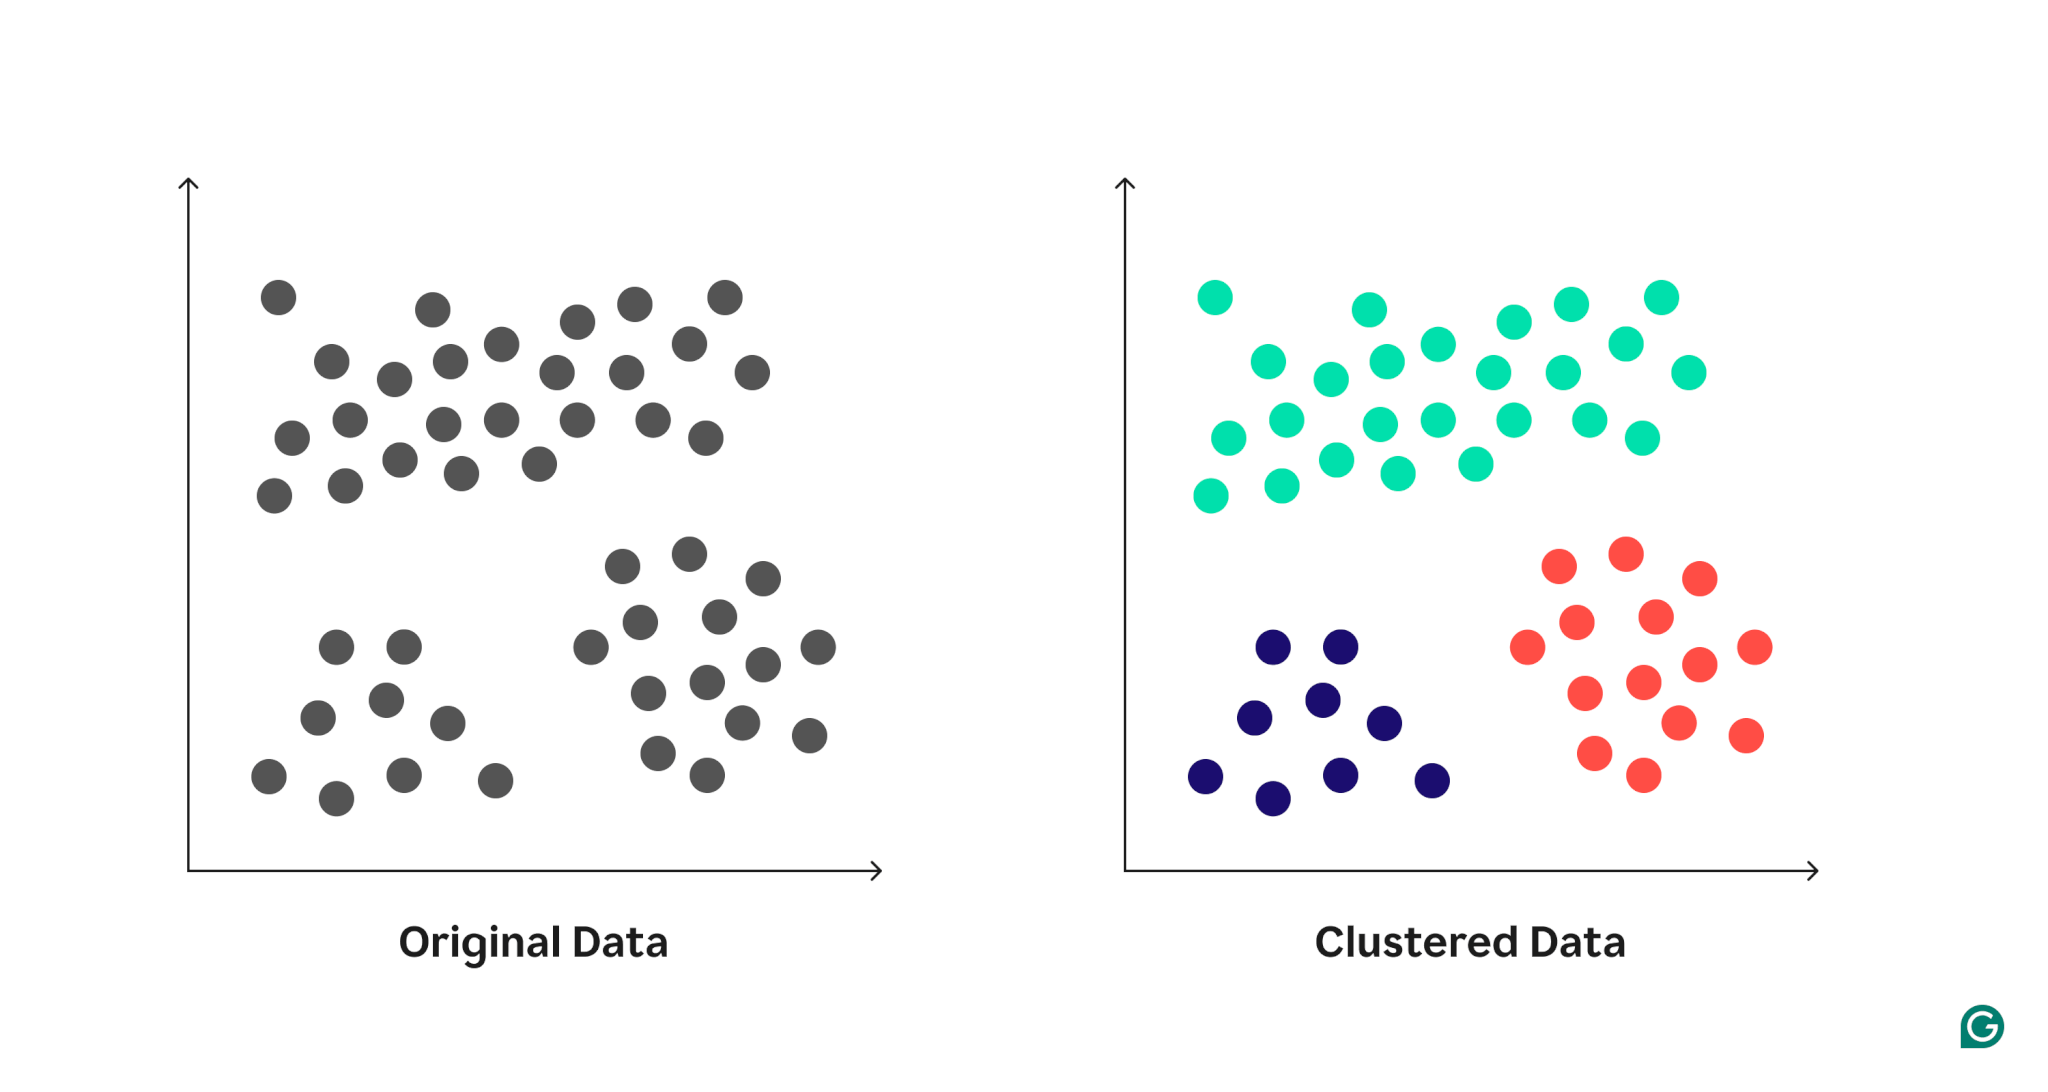
Clustering is an unsupervised learning technique used in ML to group data points into clusters based on their similarities. Each cluster contains data points that are more similar to one another than to points in other clusters. This process helps uncover natural groupings or patterns in data without requiring any prior knowledge or labels.
Clustering in machine learning:
For example, imagine you have a collection of animal images, some of cats and others of dogs. A clustering algorithm would analyze the features of each image—like shapes, colors, or textures—and group the images of cats together in one cluster and the images of dogs in another. Importantly, clustering doesn’t assign explicit labels like “cat” or “dog” (because clustering methods don’t actually understand what a dog or a cat is). It simply identifies the groupings, leaving it up to you to interpret and name those clusters.
Clustering vs. classification: What’s the difference?
Clustering and classification are often compared but serve different purposes. Clustering, an unsupervised learning method, works with unlabeled data to identify natural groupings based on similarities. In contrast, classification is a supervised learning method that requires labeled data to predict specific categories.
Clustering reveals patterns and groups without predefined labels, making it ideal for exploration. Classification, on the other hand, assigns explicit labels, such as “cat” or “dog,” to new data points based on prior training. Classification is mentioned here to highlight its distinction from clustering and help clarify when to use each approach.
How does clustering work?
Clustering identifies groups (or clusters) of similar data points within a dataset, helping uncover patterns or relationships. While specific algorithms may approach clustering differently, the process generally follows these key steps:
Step 1: Understanding data similarity
At the heart of clustering is a similarity algorithm that measures how similar data points are. Similarity algorithms differ based on which distance metrics they use to quantify data point similarity. Here are some examples:
- Geographic data: Similarity might be based on physical distance, such as the proximity of cities or locations.
- Customer data: Similarity could involve shared preferences, like spending habits or purchase histories.
Common distance measures include Euclidean distance (the straight-line distance between points) and Manhattan distance (the grid-based path length). These measures help define which points should be grouped.
Step 2: Grouping data points
Once similarities are measured, the algorithm organizes the data into clusters. This involves two main tasks:
- Identifying groups: The algorithm finds clusters by grouping nearby or related data points. Points closer together in the feature space will likely belong to the same cluster.
- Refining clusters: The algorithm iteratively adjusts groupings to improve their accuracy, ensuring that data points in a cluster are as similar as possible while maximizing the separation between clusters.
For example, in a customer segmentation task, initial groupings may divide customers based on spending levels, but further refinements might reveal more nuanced segments, such as “frequent bargain shoppers” or “luxury buyers.”
Step 3: Choosing the number of clusters
Deciding how many clusters to create is a critical part of the process:
- Predefined clusters: Some algorithms, like k-means, require you to specify the number of clusters up front. Choosing the right number often involves trial and error or visual techniques like the “elbow method,” which identifies the optimal number of clusters based on diminishing returns in cluster separation.
- Automatic clustering: Other algorithms, such as DBSCAN (density-based spatial clustering of applications with noise), determine the number of clusters automatically based on the data’s structure, making them more flexible for exploratory tasks.
The choice of clustering method often depends on the dataset and the problem you’re trying to solve.
Step 4: Hard vs. soft clustering
Clustering approaches differ in how they assign data points to clusters:
- Hard clustering: Each data point belongs exclusively to one cluster. For example, customer data might be split into distinct segments like “low spenders” and “high spenders,” with no overlap between groups.
- Soft clustering: Data points can belong to multiple clusters, with probabilities assigned to each. For instance, a customer who shops both online and in-store might belong partially to both clusters, reflecting a mixed behavior pattern.
Clustering algorithms transform raw data into meaningful groups, helping uncover hidden structures and enabling insights into complex datasets. While the exact details vary by algorithm, this overarching process is key to understanding how clustering works.
Clustering algorithms
Clustering algorithms group data points based on their similarities, helping to reveal patterns in data. The most common types of clustering algorithms are centroid-based, hierarchical, density-based, and distribution-based clustering. Each method has its strengths and is suited to specific kinds of data and goals. Below is an overview of each approach:
Centroid-based clustering
Centroid-based clustering relies on a representative center, called a centroid, for each cluster. The goal is to group data points close to their centroid while ensuring the centroids are as far apart as possible. A well-known example is k-means clustering, which starts by placing centroids randomly in the data. Data points are assigned to the nearest centroid, and the centroids are adjusted to the average position of their assigned points. This process repeats until the centroids don’t move much. K-means is efficient and works well when you know how many clusters to expect, but it can struggle with complex or noisy data.
Hierarchical clustering
Hierarchical clustering builds a treelike structure of clusters. In the most common method, agglomerative clustering, each data point begins as a one-point cluster. Clusters closest to each other are merged repeatedly until only one large cluster remains. This process is visualized using a dendrogram, a tree diagram that shows the merging steps. By choosing a specific level of the dendrogram, you can decide how many clusters to create. Hierarchical clustering is intuitive and doesn’t require specifying the number of clusters up front, but it can be slow for large datasets.
Density-based clustering
Density-based clustering focuses on finding dense regions of data points while treating sparse areas as noise. DBSCAN is a widely used method that identifies clusters based on two parameters: epsilon (the maximum distance for points to be considered neighbors) and min_points (the minimum number of points needed to form a dense region). DBSCAN doesn’t require defining the number of clusters in advance, making it flexible. It performs well with noisy data. However, if the two parameter values aren’t chosen carefully, the resulting clusters can be meaningless.
Distribution-based clustering
Distribution-based clustering assumes that the data is generated from overlapping patterns described by probability distributions. Gaussian mixture models (GMM), where each cluster is represented by a Gaussian (bell-shaped) distribution, are a common approach. The algorithm calculates the likelihood of each point belonging to each distribution and adjusts the clusters to better fit the data. Unlike hard clustering methods, GMM allows for soft clustering, meaning a point can belong to multiple clusters with different probabilities. This makes it ideal for overlapping data but requires careful tuning.
Real-world applications of clustering
Clustering is a versatile tool used across numerous fields to uncover patterns and insights in data. Here are a few examples:
Music recommendations
Clustering can group users based on their music preferences. By converting a user’s favorite artists into numerical data and clustering users with similar tastes, music platforms can identify groups like “pop lovers” or “jazz enthusiasts.” Recommendations can be tailored within these clusters, such as suggesting songs from user A’s playlist to user B if they belong to the same cluster. This approach extends to other industries, such as fashion, movies, or automobiles, where consumer preferences can drive recommendations.
Anomaly detection
Clustering is highly effective for identifying unusual data points. By analyzing data clusters, algorithms like DBSCAN can isolate points that are far from others or explicitly labeled as noise. These anomalies often signal issues such as spam, fraudulent credit card transactions, or cybersecurity threats. Clustering provides a quick way to identify and act on these outliers, ensuring efficiency in fields where anomalies can have serious implications.
Customer segmentation
Businesses use clustering to analyze customer data and segment their audience into distinct groups. For instance, clusters might reveal “young buyers who make frequent, low-value purchases” versus “older buyers who make fewer, high-value purchases.” These insights enable companies to craft targeted marketing strategies, personalize product offerings, and optimize resource allocation for better engagement and profitability.
Image segmentation
In image analysis, clustering groups similar pixel regions, segmenting an image into distinct objects. In healthcare, this technique is used to identify tumors in medical scans like MRIs. In autonomous vehicles, clustering helps differentiate pedestrians, vehicles, and buildings in input images, improving navigation and safety.
Advantages of clustering
Clustering is an essential and versatile tool in data analysis. It is particularly valuable as it doesn’t require labeled data and can quickly uncover patterns within datasets.
Highly scalable and efficient
One of the core benefits of clustering is its strength as an unsupervised learning technique. Unlike supervised methods, clustering does not require labeled data, which is often the most time-consuming and expensive aspect of ML. Clustering allows analysts to work directly with raw data and bypasses the need for labels.
Additionally, clustering methods are computationally efficient and scalable. Algorithms such as k-means are particularly efficient and can handle large datasets. However, k-means is limited: It is sometimes inflexible and sensitive to noise. Algorithms like DBSCAN are more robust to noise and capable of identifying clusters of arbitrary shapes, although they may be computationally less efficient.
Aids in data exploration
Clustering is often the first step in data analysis, as it helps uncover hidden structures and patterns. By grouping similar data points, it reveals relationships and highlights outliers. These insights can guide teams in forming hypotheses and making data-driven decisions.
Furthermore, clustering simplifies complex datasets. It can be used to reduce their dimensions, which aids in visualization and further analysis. This makes it easier to explore the data and identify actionable insights.
Challenges in clustering
While clustering is a powerful tool, it is rarely used in isolation. It often needs to be used in tandem with other algorithms to make meaningful predictions or derive insights.
Lack of interpretability
Clusters produced by algorithms are not inherently interpretable. Understanding why specific data points belong to a cluster requires manual examination. Clustering algorithms do not provide labels or explanations, leaving users to infer the meaning and significance of clusters. This can be particularly challenging when working with large or complex datasets.
Sensitivity to parameters
Clustering results are highly dependent on the choice of algorithm parameters. For instance, the number of clusters in k-means or the epsilon and min_points parameters in DBSCAN significantly impact the output. Determining optimal parameter values often involves extensive experimentation and may require domain expertise, which can be time-consuming.
The curse of dimensionality
High-dimensional data presents significant challenges for clustering algorithms. In high-dimensional spaces, distance measures become less effective, as data points tend to appear equidistant, even when they are distinct. This phenomenon, known as the “curse of dimensionality,” complicates the task of identifying meaningful similarities.
Dimensionality-reduction techniques, such as principal component analysis (PCA) or t-SNE (t-distributed stochastic neighbor embedding), can mitigate this issue by projecting data into lower-dimensional spaces. These reduced representations allow clustering algorithms to perform more effectively.