

The F1 score is a powerful metric for evaluating machine learning (ML) models designed to perform binary or multiclass classification. This article will explain what the F1 score is, why it’s important, how it’s calculated, and its applications, benefits, and limitations.
Table of contents
- What is an F1 score?
- How to calculate an F1 score
- F1 score vs. accuracy
- Applications of the F1 score
- Benefits of the F1 score
- Limitations of the F1 score
What is an F1 score?
ML practitioners face a common challenge when building classification models: training the model to catch all cases while avoiding false alarms. This is particularly important in critical applications like financial fraud detection and medical diagnosis, where false alarms and missing important classifications have serious consequences. Achieving the right balance is particularly important when dealing with imbalanced datasets, where a category like fraudulent transactions is much rarer than the other category (legitimate transactions).
Precision and recall
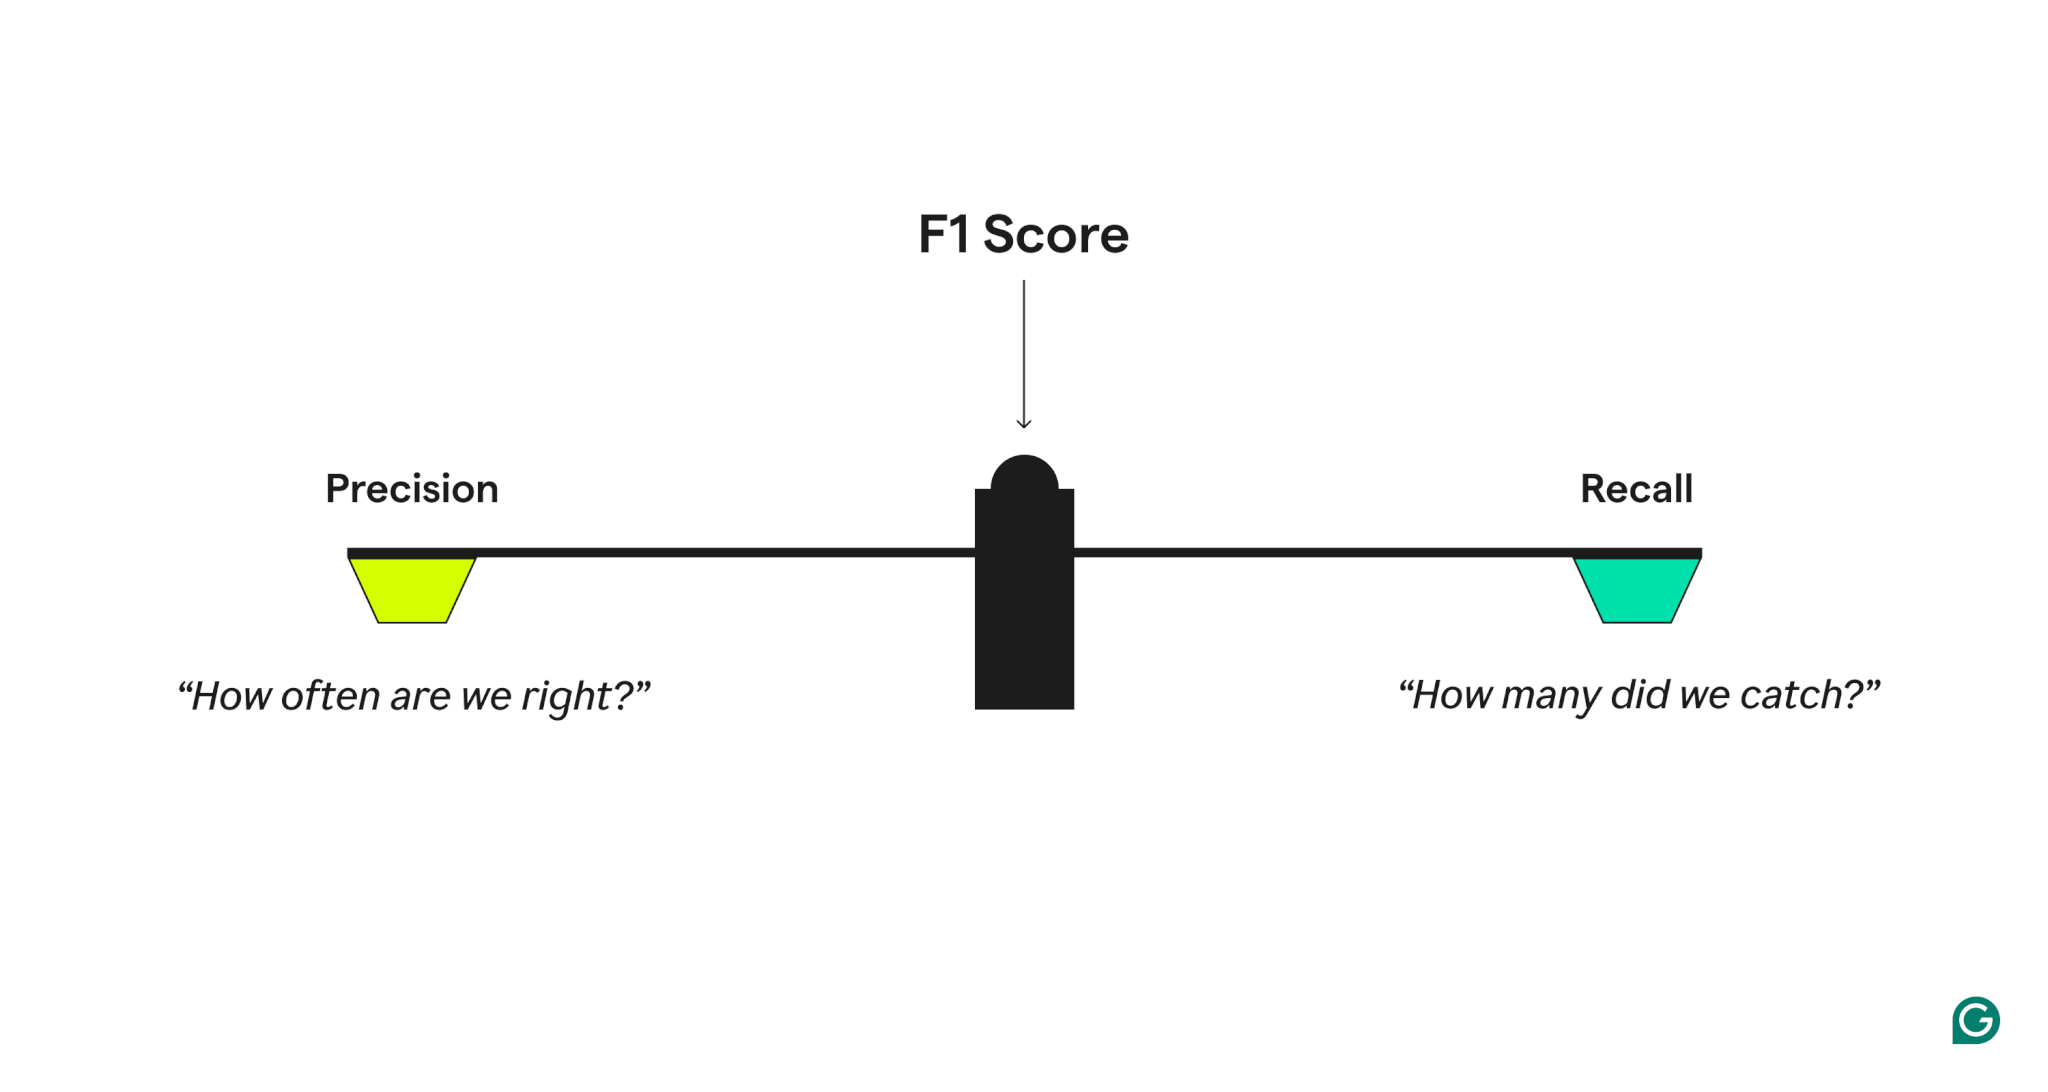
To measure model performance quality, the F1 score combines two related metrics:
- Precision, which answers, “When the model predicts a positive case, how often is it correct?”
- Recall, which answers, “Of all actual positive cases, how many did the model correctly identify?”
A model with high precision but low recall is overly cautious, missing many true positives, while one with high recall but low precision is overly aggressive, generating many false positives. The F1 score strikes a balance by taking the harmonic mean of precision and recall, which gives more weight to lower values and ensures that a model performs well on both metrics rather than excelling in just one.
Precision and recall example
To better understand precision and recall, consider a spam detection system. If the system has a high rate of correctly flagging emails as spam, this means it has high precision. For example, if the system flags 100 emails as spam, and 90 of them are actually spam, the precision is 90%. High recall, on the other hand, means the system catches most actual spam emails. For example, if there are 200 actual spam emails and our system catches 90 of them, the recall is 45%.
Variants of the F1 score
In multiclass classification systems or scenarios with specific needs, the F1 score can be calculated in different ways, depending on what factors are important:
- Macro-F1: Calculates the F1 score separately for each class and takes the average
- Micro-F1: Calculates recall and precision over all predictions
- Weighted-F1: Similar to Macro-F1, but classes are weighted based on frequency
Beyond the F1 score: The F-score family
The F1 score is part of a larger family of metrics called the F-scores. These scores offer different ways to weight precision and recall:
- F2: Places greater emphasis on recall, which is useful when false negatives are costly
- F0.5: Places greater emphasis on precision, which is useful when false positives are costly
How to calculate an F1 score
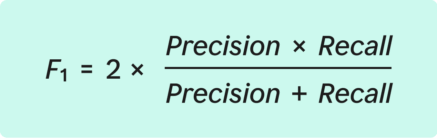
The F1 score is mathematically defined as the harmonic mean of precision and recall. While this might sound complex, the calculation process is straightforward when broken down into clear steps.
The formula for the F1 score:
Before diving into the steps to calculate F1, it’s important to understand the key components of what’s called a confusion matrix, which is used to organize classification results:
- True positives (TP): The number of cases correctly identified as positive
- False positives (FP): The number of cases incorrectly identified as positive
- False negatives (FN): The number of cases missed (actual positives that were not identified)
The general process involves training the model, testing predictions and organizing results, calculating precision and recall, and calculating the F1 score.
Step 1: Train a classification model
First, a model must be trained to make binary or multiclass classifications. This means that the model needs to be able to classify cases as belonging to one of two categories. Examples include “spam/not spam” and “fraud/not fraud.”
Step 2: Test predictions and organize results
Next, use the model to perform classifications on a separate dataset that wasn’t used as part of the training. Organize the results into the confusion matrix. This matrix shows:
- TP: How many predictions were actually correct
- FP: How many positive predictions were incorrect
- FN: How many positive cases were missed
The confusion matrix provides an overview of how the model is performing.
Step 3: Calculate precision
Using the confusion matrix, precision is calculated with this formula:

For example, if a spam detection model correctly identified 90 spam emails (TP) but incorrectly flagged 10 nonspam emails (FP), the precision is 0.90.

Step 4: Calculate recall
Next, calculate recall using the formula:

Using the spam detection example, if there were 200 total spam emails, and the model caught 90 of them (TP) while missing 110 (FN), the recall is 0.45.

Step 5: Calculate the F1 score
With the precision and recall values in hand, the F1 score can be calculated.
The F1 score ranges from 0 to 1. When interpreting the score, consider these general benchmarks:
- 0.9 or higher: The model is performing great, but should be checked for overfitting.
- 0.7 to 0.9: Good performance for most applications
- 0.5 to 0.7: Performance is OK, but the model could use improvement.
- 0.5 or less: The model is performing poorly and needs serious improvement.
Using the spam detection example calculations for precision and recall, the F1 score would be 0.60 or 60%.

In this case, the F1 score indicates that, even with high precision, the lower recall is affecting overall performance. This suggests that there’s room for improvement in catching more spam emails.
F1 score vs. accuracy
While both F1 and accuracy quantify model performance, the F1 score provides a more nuanced measure. Accuracy simply calculates the percentage of correct predictions. However, just relying on accuracy to measure model performance can be problematic when the number of instances of one category in a dataset significantly outnumbers the other category. This problem is referred to as the accuracy paradox.
To understand this problem, consider the example of the spam detection system. Suppose an email system receives 1,000 emails every day, but only 10 of those are actually spam. If spam detection simply classifies every email as not spam, it will still achieve 99% accuracy. This is because 990 predictions out of 1,000 were correct, even though the model is actually useless when it comes to spam detection. Clearly, accuracy does not give an accurate picture of the quality of the model.
The F1 score avoids this problem by combining the precision and recall measurements. Therefore, F1 should be used instead of accuracy in the following cases:
- The dataset is imbalanced. This is common in fields like diagnosis of obscure medical conditions or spam detection, where one category is relatively rare.
- FN and FP are both important. For example, medical screening tests seek to balance catching actual issues with not raising false alarms.
- The model needs to strike a balance between being too aggressive and too cautious. For example, in spam filtering, an overly cautious filter might let through too much spam (low recall) but rarely make mistakes (high precision). On the other hand, an overly aggressive filter might block real emails (low precision) even if it does catch all spam (high recall).
Applications of the F1 score
The F1 score has a wide range of applications across various industries where balanced classification is critical. These applications include financial fraud detection, medical diagnosis, and content moderation.
Financial fraud detection
Models designed to detect financial fraud are a category of systems well suited for measurement using the F1 score. Financial firms often process millions or billions of transactions daily, with actual cases of fraud being relatively rare. For this reason, a fraud detection system needs to catch as many fraudulent transactions as possible while simultaneously minimizing the number of false alarms and resulting inconvenience to customers. Measuring the F1 score can help financial institutions determine how well their systems balance the twin pillars of fraud prevention and a good customer experience.
Medical diagnosis
In medical diagnosis and testing, FN and FP both have serious consequences. Consider the example of a model designed to detect rare forms of cancer. Incorrectly diagnosing a healthy patient could lead to unnecessary stress and treatment, while missing an actual cancer case will have dire consequences for the patient. In other words, the model needs to have both high precision and high recall, which is something that the F1 score can measure.
Content moderation
Moderating content is a common challenge in online forums, social media platforms, and online marketplaces. To achieve platform safety without overcensoring, these systems must balance precision and recall. The F1 score can help platforms determine how well their system balances these two factors.
Benefits of the F1 score
In addition to generally providing a more nuanced view of model performance than accuracy, the F1 score provides several key advantages when evaluating classification model performance. These benefits include faster model training and optimization, reduced training costs, and catching overfitting early.
Faster model training and optimization
The F1 score can help speed up model training by providing a clear reference metric that can be used to guide optimization. Instead of tuning recall and precision separately, which generally involves complex trade-offs, ML practitioners can focus on increasing the F1 score. With this streamlined approach, optimal model parameters can be identified quickly.
Reduced training costs
The F1 score can help ML practitioners make informed decisions about when a model is ready for deployment by providing a nuanced, single measure of model performance. With this information, practitioners can avoid unnecessary training cycles, investments in computational resources, and having to acquire or create additional training data. Overall, this can lead to substantial cost reductions when training classification models.
Catching overfitting early
Since the F1 score considers both precision and recall, it can help ML practitioners identify when a model is becoming too specialized in the training data. This problem, called overfitting, is a common issue with classification models. The F1 score gives practitioners an early warning that they need to adjust training before the model reaches a point where it is unable to generalize on real-world data.
Limitations of the F1 score
Despite its many benefits, the F1 score has several important limitations that practitioners should consider. These limitations include a lack of sensitivity to true negatives, not being suited for some datasets, and being harder to interpret for multiclass problems.
Lack of sensitivity to true negatives
The F1 score doesn’t account for true negatives, which means that it is not well suited for applications where measuring this is important. For example, consider a system designed to identify safe driving conditions. In this case, correctly identifying when conditions are genuinely safe (true negatives) is just as important as identifying dangerous conditions. Because it doesn’t track FN, the F1 score wouldn’t accurately capture this aspect of overall model performance.
Not suited for some datasets
The F1 score may not be suited for datasets where the impact of FP and FN are significantly different. Consider the example of a cancer screening model. In such a situation, missing a positive case (FN) could be life-threatening, while wrongly finding a positive case (FP) only leads to additional testing. So, using a metric that can be weighted to account for this cost is a better choice than the F1 score.
Harder to interpret for multiclass problems
While variations like micro-F1 and macro-F1 scores mean that the F1 score can be used to evaluate multiclass classification systems, interpreting these aggregated metrics is often more complex than the binary F1 score. For example, the micro-F1 score might hide poor performance in classifying less frequent classes, while the macro-F1 score might overweight rare classes. Given this, businesses need to consider whether equal treatment of classes or overall instance-level performance is more important when choosing the right F1 variant for multiclass classification models.