

Parth Aidasani, Marina Adario, and Nitin Lakhara from Grammarly’s Data Science team co-wrote this article.
Grammarly’s ongoing investment in paid marketing has helped to grow our active user base, making it an important part of Grammarly’s marketing strategy. As we continue to use paid acquisition channels to support our growth goals, we want to continuously evaluate our budget allocation across each channel. These efforts ensure that we maintain efficiency and scalability, allowing us to maximize the return on our ad investment.
To improve how we allocate budget and ensure we can continuously evaluate channel efficiency to inform budget decisions, we built an AI-powered budget allocation framework. We designed this tool to be self-serve so that marketers and finance teams can use it to make budget decisions based on current data signals throughout the year.
In this post, we’ll explore the process of building this tool, walk through how we used machine learning processes, and explain the real-world considerations of building such a tool.
Today’s budget allocation challenge
At Grammarly, we have a significant marketing budget to allocate and 20+ channels to spread it among. Our previous budget allocation process was lengthy, manual, and largely qualitative—leaning on domain knowledge. First-touch attribution informed many decisions, which was misleading because of its dependence on click-based tracking and its tendency to overlook many touchpoints in the consumer journey. Additionally, we made decisions without data on how each channel’s efficiency varies with spending changes, which limited our understanding of channel-level budget changes. These approaches often led us to allocate budget to non-incremental channels, as a result of relying on a traditional attribution model and allocating budget to channels that are efficient but don’t scale.
We could see the enormous potential of optimal budget allocation on revenue, so we wanted to move to a more efficient, data-driven, and ML-powered approach. By building a data product, we could empower our marketing team members to continuously evaluate budget allocations and make adjustments to maximize the return on our investment.
Introducing: BEAM
We created BEAM, Grammarly’s Budget Evaluation and Allocation Manager. BEAM is a self-service tool designed to enable our marketing and finance leaders to make data-driven budget allocation decisions.
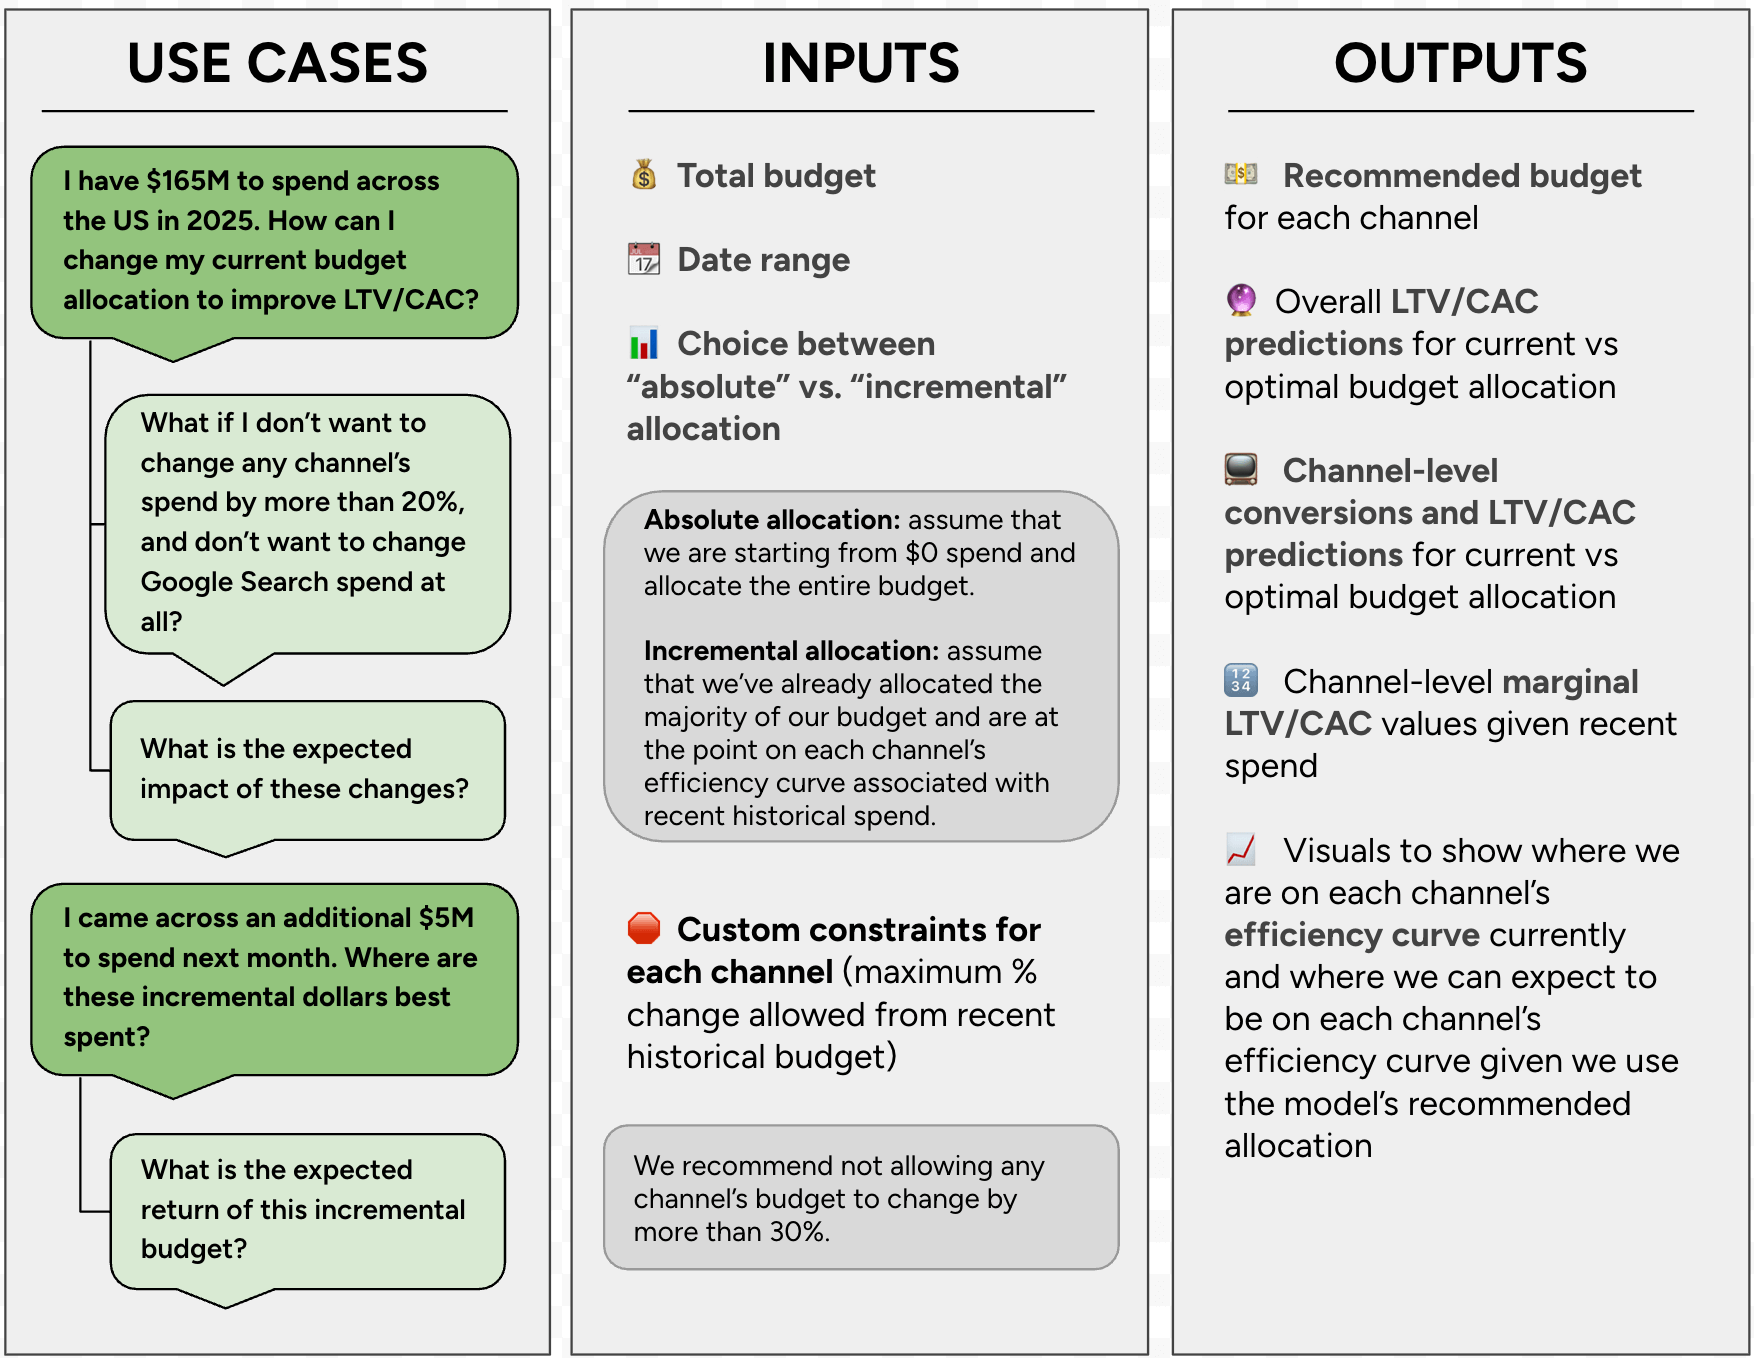
Tool #1: Budget allocator tool
BEAM’s primary functionality is as a budget allocator tool. Users can input a total budget and date range, among other custom inputs, and the tool will recommend the optimal allocation across channels.
LTV/CAC = Life Time Value / Customer Acquisition Cost
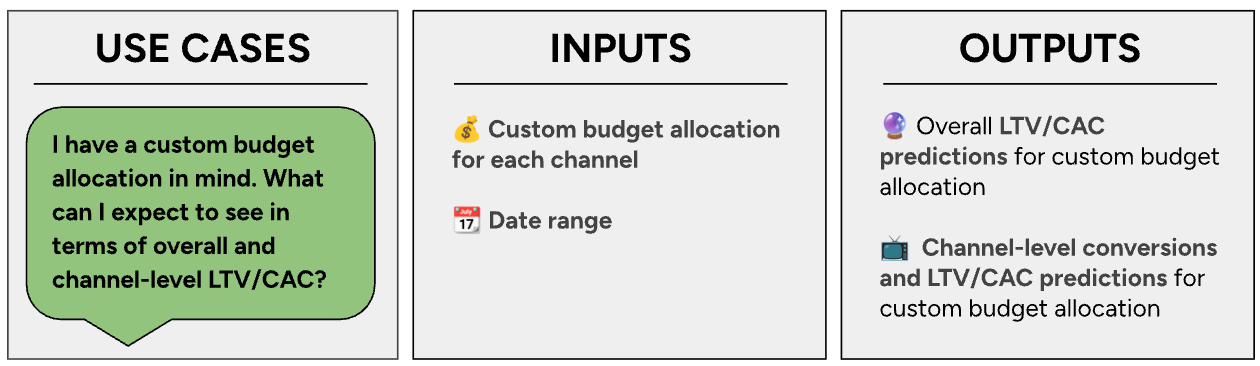
Tool #2: Budget impact assessment tool
This tool, less frequently used but still impactful, allows users to estimate the performance of specific budget allocations. Users input a custom budget allocation, and the tool outputs the resulting LTV/CAC they can expect, including overall and by channel.
Methodology
Budget allocation as a constrained optimization problem
Think of budget allocation as a constrained optimization problem. We have a set total budget and want to optimally allocate this budget across channels to maximize return on investment, taking overall efficiency and diminishing returns of each channel into account.
We also add a constraint that limits spending so that each channel’s spend should change by no more than 30% from its recent historical spend level. This constraint ensures we avoid making drastic changes that risk harming ad platform performance and avoid extrapolating model results outside of the historical training data range. This number can vary dynamically based on each team’s risk appetite.
For the sake of simplicity, let’s assume that we have just three marketing channels: Search, YouTube, and TV. The objective function and constraints for our optimization are as follows:
Objective function
New Active Users = f(Search Spend, YouTube Spend, TV Spend)
Constraints
- Search Spend + YouTube Spend +TV Spend= Total Budget
- (Prev Search Spend*0.7)<Search Spend <(Prev Search Spend *1.3)
- (Prev YouTube Spend* 0.7) <YouTube Spend <Prev YouTube Spend *1.3)
- (Prev TV Spend* 0.7) <TV Spend <Prev TV Spend *1.3)
This provides us with a starting point.
Marketing Mix Model (MMM)
Now, the hard part: how do we define f(Search Spend, YouTube Spend, TV Spend) ? Here, we use a Marketing Mix Model, or MMM. Specifically, we use a Bayesian MMM implemented via pymc-marketing. This allows us to predict weekly new active user volume as a function of each channel’s spend along with seasonality and, optionally, other external variables.
We fit:
NAUw = α + βSearch * ƒ(SearchSpendw) + βYouTube * ƒ(YouTubeSpendw) + βTV * ƒ(TVSpendw) + Sw + εw
where NAUw is total new active user volume in week w, and f({channel}Spendw) represents a transformation on each channel’s spend in week w. This includes both ad stock and saturation transformations (more details on these later). Sw represents a seasonal component at week w, and w is a normally distributed error term.
Let’s break down each component of the model.
Intercept
The intercept term is a fitted parameter that represents how many new active users we’d expect to get in an average week with no marketing spend.
Seasonality component
We include fitted seasonal components into the model to control for seasonal effects. Seasonal effects, such as Black Friday, can greatly impact new active user volume in a given week.
Ad-stock transformation
We don’t expect the entire impact of ad spend to be realized immediately, especially for top-of-funnel channels like TV. To account for this, we include a geometric ad-stock transformation in our model. The transformed spend value in a given week is a weighted average of the current week’s spend along with the l prior weeks, which reduces the weight of a given week as we go further back in time. We let the model fit the number of lagged weeks l along with the parameter , which defines the magnitude of decay over time.
Saturation transformation
We know that the relationship between spend and returns is not linear. As we spend more, we see diminishing returns. In other words, each incremental dollar is less valuable than the last. We expect the relationship between spend and new active users to follow a shape like the one in the chart below:
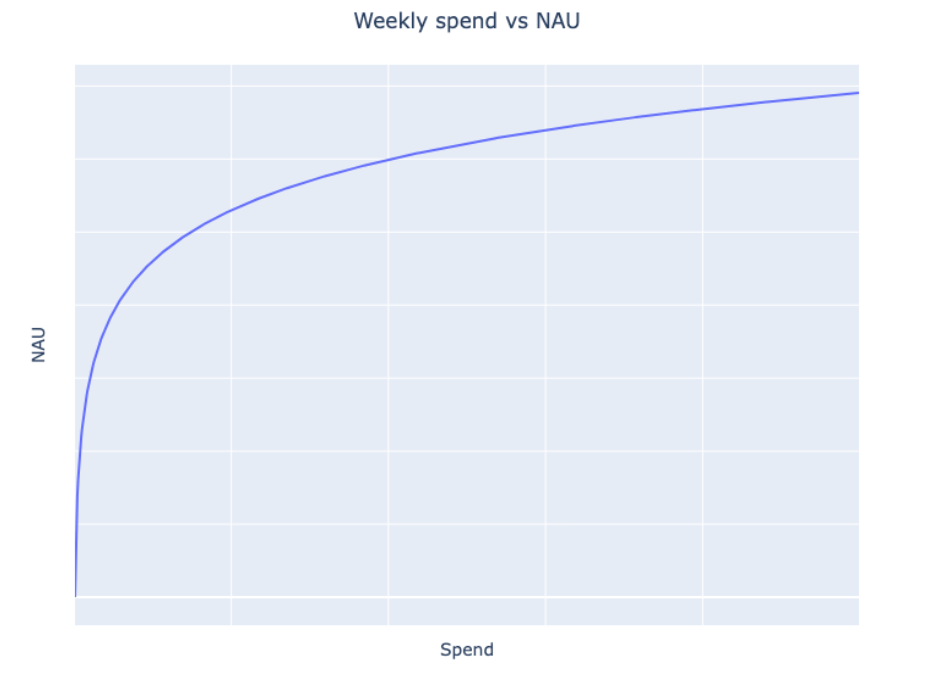
We use a logistic saturation transformation to measure the rate of diminishing returns. Specifically, we transform each channel’s spend using the following:
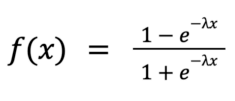
We need to fit one parameter λ, which represents the rate of saturation. For most of our channels, we have attribution data from the ad platforms that we can use to quantify the relationship between spend and returns. We find the value of λ that best fits the ad platform data and input this value as a prior into our final MMM model. Since we are using a Bayesian model, we can input priors for any of the parameters and allow the model to learn their optimal value.
Back to the optimization problem
We’ve now fit the MMM, which defines our objective function:
New Active Users = ƒ(Search Spend, YouTube Spend, TV Spend)
Additionally, we consider the Life Time Value (LTV) per new active user because each new user will have a different predicted LTV based on their demographics and product activity. This enables us to optimize for a monetary-based user value, not just a free user event.
We are now ready to solve the constrained optimization problem. We use Sequential Least Squares Programming, or SLSQP (implemented via scipy.optimize.minimize), to find the optimal value for each channel’s budget given this objective function and our previously defined constraints.
In short, we can think of our budget allocation solution as having three separate parts, each feeding into the next.
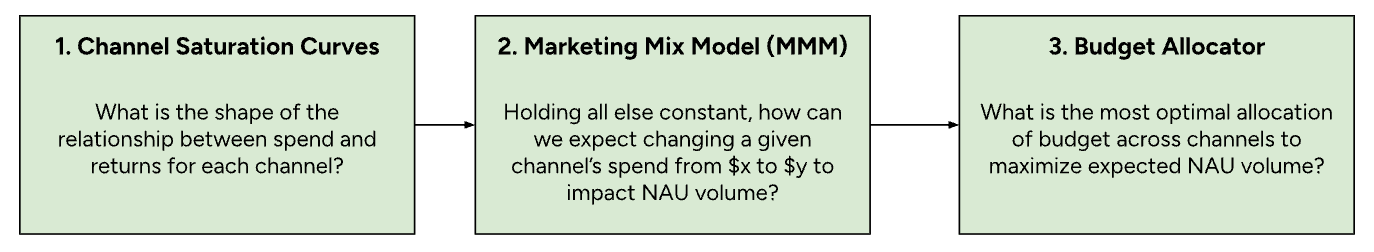
Looking into the black box
A key component of BEAM is giving users visibility into why the model is making its decisions. We include a series of charts that visualize the fitted relationship between spend and new active users, lifetime value for each channel, and current versus recommended spend amounts. Below is a simplified example of one of these charts.
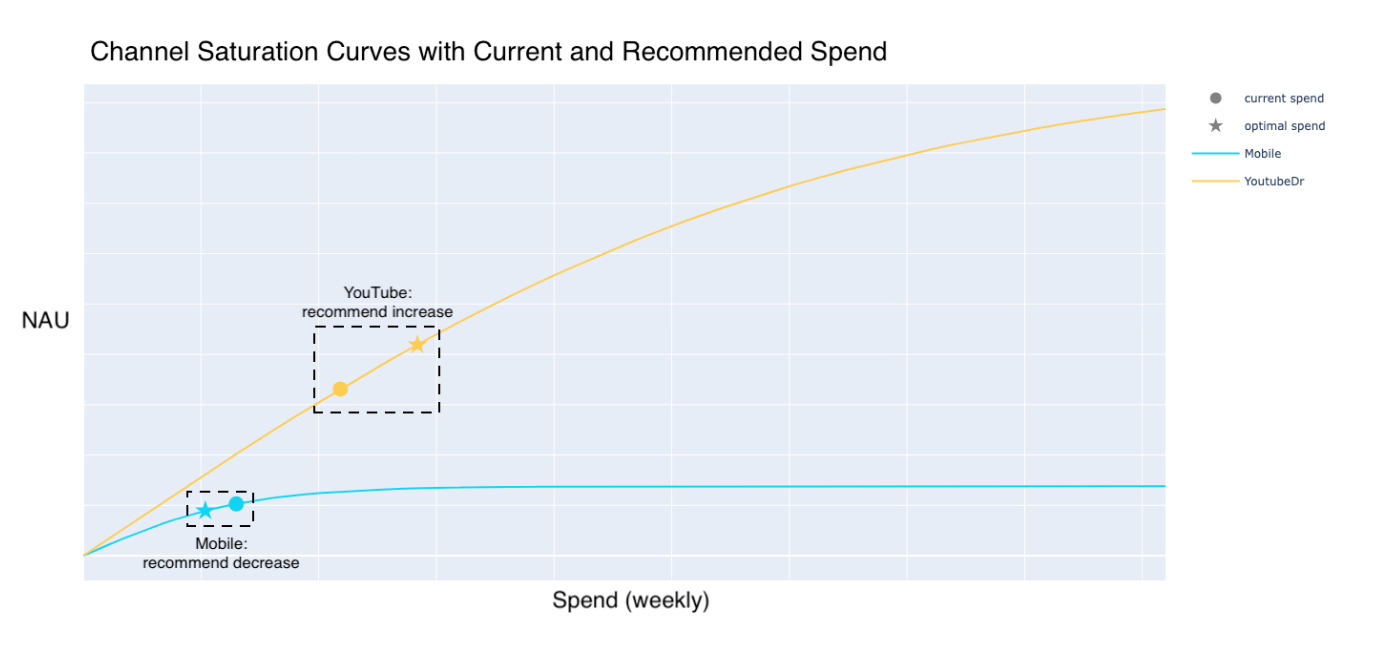
In this example, current YouTube spend is still on an increasing part of the curve, implying that an increase in spend will lead to a substantial increase in new active users. Alternatively, for Mobile, current spend levels are on the flatter part of the curve, so the model recommends decreasing the budget since it can be more efficiently allocated elsewhere.
Current state vs. future state
Budget allocation has always been a critical challenge in marketing, requiring teams to make data-driven decisions about where to invest for maximum return, but often with limited or unreliable data. Our journey from a manual attribution–based approach to a more advanced Marketing Mix Model (MMM) that includes automated optimization has significantly improved how we allocate budgets.
Past state: Click attribution–based, ads platform data, and manual allocation
In the past, our marketing data science team relied heavily on deterministic attribution models. They primarily focused on the first-click model and a qualitative, heuristic-based understanding of our channels to allocate budget across them. This approach had several limitations.
- Heavily reliant on digital click touchpoints: Our attribution model primarily relied on click-based touchpoints, which severely underestimated the impact of our top-of-funnel/view-based channels, as well as allocating all the credit to the first interaction, ignoring the rest of the touchpoints in a user’s journey.
- Manual decision-making: Budget allocation was an iterative process, often based on historical trends, gut instinct, and discussions between marketing and finance leaders.
- Lack of visibility into diminishing returns: There was no clear understanding of how increased spend on a channel might lead to diminishing returns and at what point these diminishing returns made our marketing spend less efficient.
- Increased tracking limitations: The growth of online privacy measures has caused significant limitations across cookie data, making it difficult for marketing teams to connect ad exposures to conversions accurately.
Current state: Automated budget allocator
Today, we use a Marketing Mix Model to make budget allocation decisions, solving many of the limitations listed above. Our current state has also brought several improvements.
- Captures full-funnel and cross-channel effects: MMM does not rely on digital touchpoints, so it is unaffected by attribution gaps. This allows the MMM to understand the relationship between spend and business impact from channels across the funnel from TV to paid search, allowing us to compare efficiencies across channels at different points in the funnel.
- Accounts for long-term lag effects: Unlike attribution models, MMM considers the delayed impact of media buys, especially those across video inventory that may not result in immediate action.
- Incorporates spend elasticity: We now understand how additional spend on a channel contributes to incremental gains and at what point there are diminishing returns. This helps us better answer “Where should we invest our next marketing dollar?”
- Automated budget optimization: By using optimization functions, we can now make budget decisions within a matter of minutes, as opposed to manual exercises that could take weeks and extensive resources.
- Resilient to data privacy changes: Since MMM does not rely on user-level tracking, it remains unaffected by evolving privacy regulations.
Evaluation and validation
While automation and MMM-driven budget allocation have several advantages, it is important to continuously evaluate and validate the model and make recommendations to ensure it leads to the predicted outcomes. Some of those techniques include:
- Backtesting with historical data: Assessing the accuracy of our model by applying prior budget allocations and comparing the predictions to actual performance.
- Holdout tests: Build geo-based holdout tests where one set of regions is using the past method’s budget allocation, and the second region is using our current improved method. Together, these can measure the impact and lift of this new approach.
- Conversion lift testing: Conversion lift/incrementality testing across each channel leveraged to validate the coefficients and MMM predictions.
- Calibration of priors: We calibrate our priors throughout the year by leveraging conversion lift tests. This not only validates the MMM but also grounds its priors in data, reducing reliance on assumptions and historical biases. It ensures the model reflects incremental impact and adapts to changing effectiveness over time.
Closing thoughts
As marketing continues to evolve, embracing advanced measurement techniques will be key to staying ahead in an increasingly complex and privacy-constrained landscape.
The transition from a manual attribution–based approach to an automated, MMM-based approach has made significant strides in our budget allocation by using superior attribution methods, gathering more insights through spend elasticity, and using better optimization functions—all of which lead to far more accurate budget recommendations in a fraction of the time. This allows us to move past resource-intensive tasks, which included some guesswork, to a far more accurate and scalable strategy.
In addition, the self-serve tool allows marketing and finance leaders to run budget allocation exercises themselves, removing the need for active assistance from the data science team.
If you are excited about the prospect of leveraging cutting-edge data science to tackle challenges like marketing effectiveness, check out our open positions and become a part of our trailblazing journey.