
Linear regression is a foundational technique in data analysis and machine learning (ML). This guide will help you understand linear regression, how it is constructed, and its types, applications, benefits, and drawbacks.
Table of contents
- What is linear regression?
- Types of linear regression
- Linear regression vs. logistic regression
- How does linear regression work?
- Applications of linear regression
- Advantages of linear regression in ML
- Disadvantages of linear regression in ML
What is linear regression?
Linear regression is a statistical method used in machine learning to model the relationship between a dependent variable and one or more independent variables. It models relationships by fitting a linear equation to observed data, often serving as a starting point for more complex algorithms and is widely used in predictive analysis.
Essentially, linear regression models the relationship between a dependent variable (the outcome you want to predict) and one or more independent variables (the input features you use for prediction) by finding the best-fitting straight line through a set of data points. This line, called the regression line, represents the relationship between the dependent variable (the outcome we want to predict) and the independent variable(s) (the input features we use for prediction). The equation for a simple linear regression line is defined as:
y = m x + c
where y is the dependent variable, x is the independent variable, m is the slope of the line, and c is the y-intercept. This equation provides a mathematical model for mapping inputs to predicted outputs, with the goal of minimizing the differences between predicted and observed values, known as residuals. By minimizing these residuals, linear regression produces a model that best represents the data.
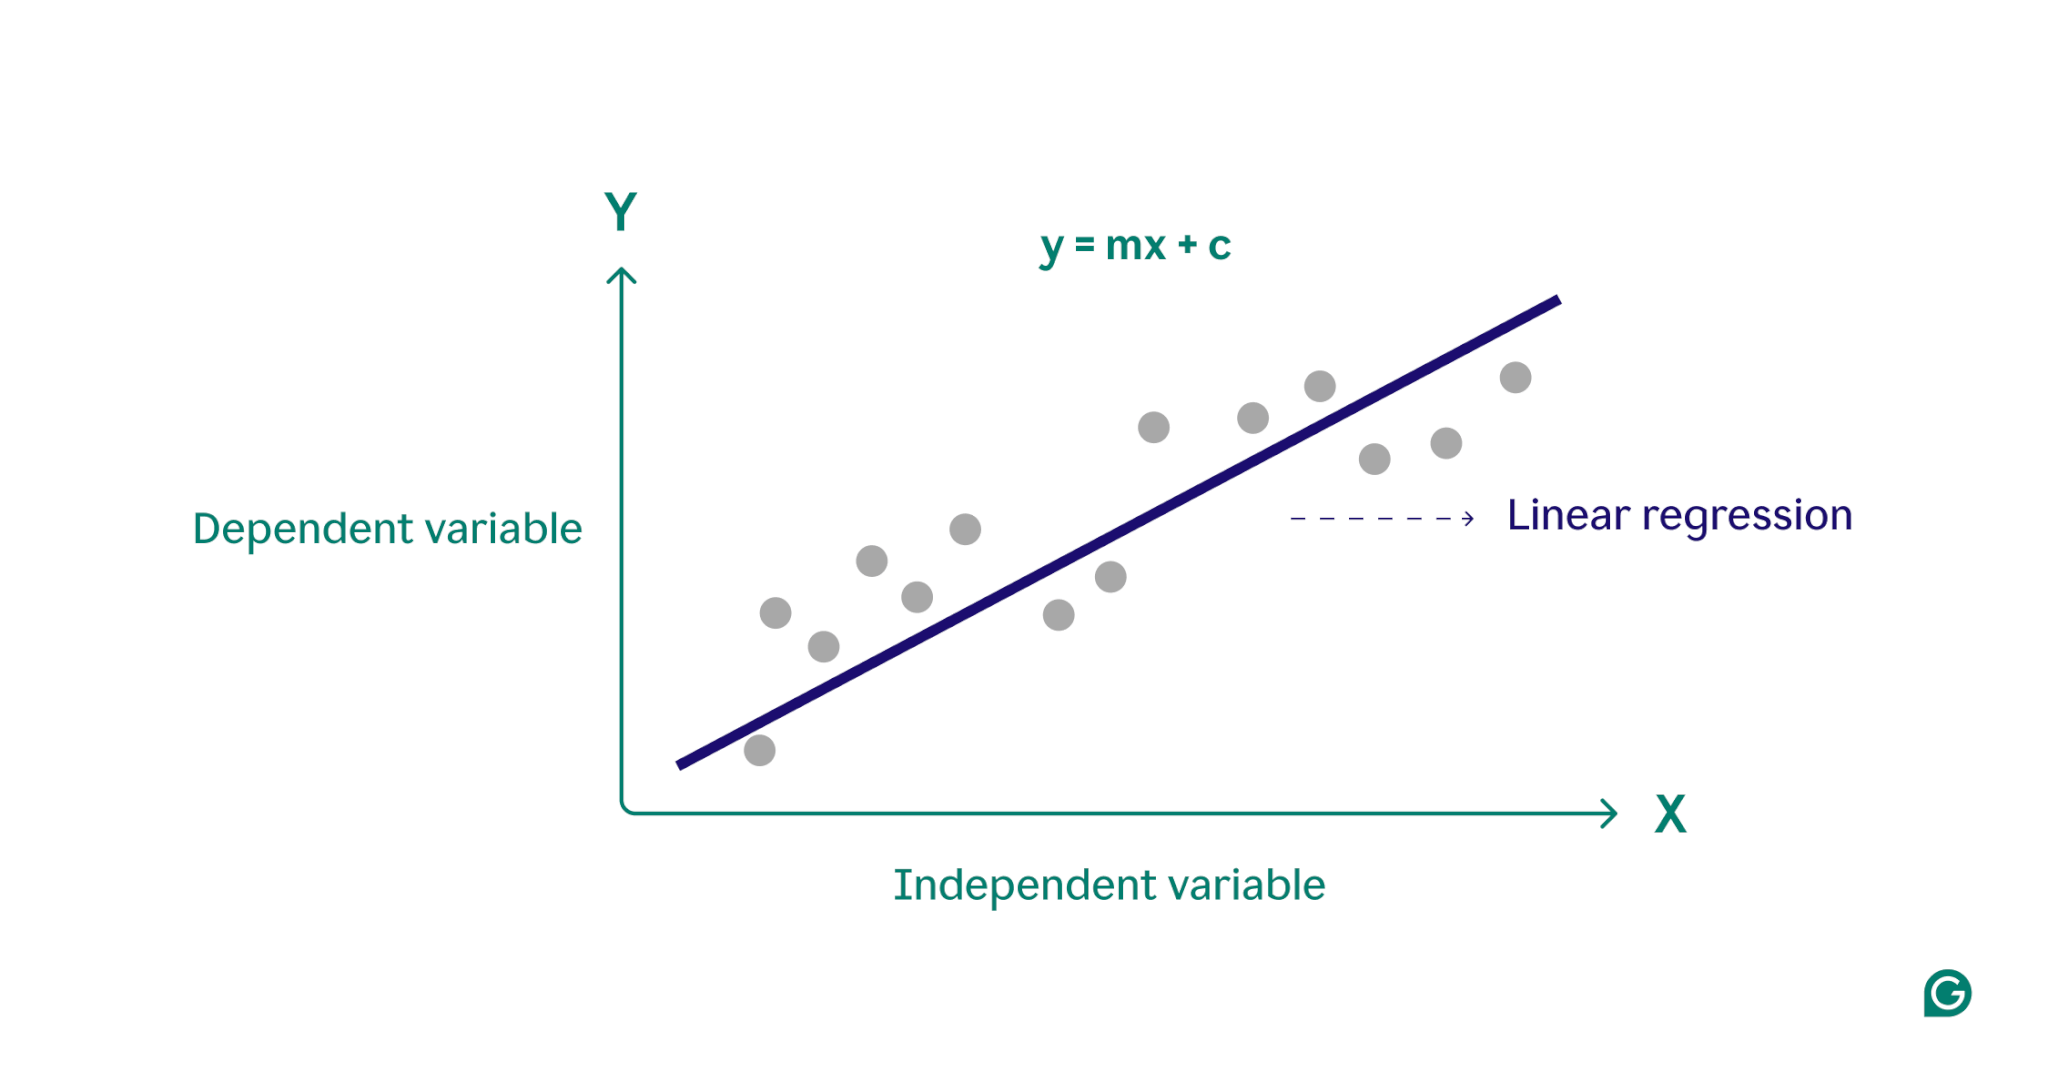
Conceptually, linear regression can be visualized as drawing a straight line through points on a graph to determine if there is a relationship between those data points. The ideal linear regression model for a set of data points is the line that best approximates the values of every point in the data set.
Types of linear regression
There are two main types of linear regression: simple linear regression and multiple linear regression.
Simple linear regression
Simple linear regression models the relationship between a single independent variable and a dependent variable using a straight line. The equation for simple linear regression is:
y = m x + c
where y is the dependent variable, x is the independent variable, m is the slope of the line, and c is the y-intercept.
This method is a straightforward way to get clear insights when dealing with single-variable scenarios. Consider a doctor trying to understand how patient height affects weight. By plotting each variable on a graph and finding the best-fitting line using simple linear regression, the doctor could predict a patient’s weight based on their height alone.
Multiple linear regression
Multiple linear regression extends the concept of simple linear regression to accommodate more than one variable, allowing for analysis of how multiple factors impact the dependent variable. The equation for multiple linear regression is:
y = b0 + b1 x1 + b2 x2 + … + bn xn
where y is the dependent variable, x1, x2, …, xn are the independent variables, and b1, b2, …, bn are the coefficients describing the relationship between each independent variable and the dependent variable.
As an example, consider a real estate agent who wants to estimate house prices. The agent could use a simple linear regression based on a single variable, like the size of the house or the zip code, but this model would be too simplistic, as housing prices are often driven by a complex interplay of multiple factors. A multiple linear regression, incorporating variables like the size of the house, the neighborhood, and the number of bedrooms, will likely provide a more accurate prediction model.
Linear regression vs. logistic regression
Linear regression is often confused with logistic regression. While linear regression predicts outcomes on continuous variables, logistic regression is used when the dependent variable is categorical, often binary (yes or no). Categorical variables define non-numeric groups with a finite number of categories, like age group or payment method. Continuous variables, on the other hand, can take any numerical value and are measurable. Examples of continuous variables include weight, price, and daily temperature.
Unlike the linear function used in linear regression, logistic regression models the probability of a categorical outcome using an S-shaped curve called a logistic function. In the example of binary classification, data points that belong to the “yes” category fall on one side of the S-shape, while the data points in the “no” category fall on the other side. Practically speaking, logistic regression can be used to classify whether an email is spam or not, or predict whether a customer will purchase a product or not. Essentially, linear regression is used for predicting quantitative values, whereas logistic regression is used for classification tasks.
How does linear regression work?
Linear regression works by finding the best-fitting line through a set of data points. This process involves:
1 Selecting the model: In the first step, the appropriate linear equation to describe the relationship between the dependent and independent variables is selected.
2 Fitting the model: Next, a technique called Ordinary Least Squares (OLS) is used to minimize the sum of the squared differences between the observed values and the values predicted by the model. This is done by adjusting the slope and intercept of the line to find the best fit. The purpose of this method is to minimize the error, or difference, between the predicted and actual values. This fitting process is a core part of supervised machine learning, in which the model learns from the training data.
3 Evaluating the model: In the final step, the quality of fit is assessed using metrics such as R-squared, which measures the proportion of the variance in the dependent variable that is predictable from the independent variables. In other words, R-squared measures how well the data actually fits the regression model.
This process generates a machine learning model that can then be used to make predictions based on new data.
Applications of linear regression in ML
In machine learning, linear regression is a commonly used tool for predicting outcomes and understanding relationships between variables across various fields. Here are some notable examples of its applications:
Forecasting consumer spending
Income levels can be used in a linear regression model to predict consumer spending. Specifically, multiple linear regression could incorporate factors such as historical income, age, and employment status to provide a comprehensive analysis. This can assist economists in developing data-driven economic policies and help businesses better understand consumer behavioral patterns.
Analyzing marketing impact
Marketers can use linear regression to understand how advertising spend affects sales revenue. By applying a linear regression model to historical data, future sales revenue can be predicted, allowing marketers to optimize their budgets and advertising strategies for maximum impact.
Predicting stock prices
In the finance world, linear regression is one of the many methods used to predict stock prices. Using historical stock data and various economic indicators, analysts and investors can build multiple linear regression models that help them make smarter investment decisions.
Forecasting environmental conditions
In environmental science, linear regression can be used to forecast environmental conditions. For example, various factors like traffic volume, weather conditions, and population density can help predict pollutant levels. These machine learning models can then be used by policymakers, scientists, and other stakeholders to understand and mitigate the impacts of various actions on the environment.
Advantages of linear regression in ML
Linear regression offers several advantages that make it a key technique in machine learning.
Simple to use and implement
Compared with most mathematical tools and models, linear regression is easy to understand and apply. It is especially great as a starting point for new machine learning practitioners, providing valuable insights and experience as a foundation for more advanced algorithms.
Computationally efficient
Machine learning models can be resource-intensive. Linear regression requires relatively low computational power compared to many algorithms and can still provide meaningful predictive insights.
Interpretable results
Advanced statistical models, while powerful, are often hard to interpret. With a simple model like linear regression, the relationship between variables is easy to understand, and the impact of each variable is clearly indicated by its coefficient.
Foundation for advanced techniques
Understanding and implementing linear regression offers a solid foundation for exploring more advanced machine learning methods. For example, polynomial regression builds on linear regression to describe more complex, non-linear relationships between variables.
Disadvantages of linear regression in ML
While linear regression is a valuable tool in machine learning, it has several notable limitations. Understanding these disadvantages is critical in selecting the appropriate machine learning tool.
Assuming a linear relationship
The linear regression model assumes that the relationship between dependent and independent variables is linear. In complex real-world scenarios, this may not always be the case. For example, a person’s height over the course of their life is nonlinear, with the quick growth occurring during childhood slowing down and stopping in adulthood. So, forecasting height using linear regression could lead to inaccurate predictions.
Sensitivity to outliers
Outliers are data points that significantly deviate from the majority of observations in a dataset. If not handled properly, these extreme value points can skew results, leading to inaccurate conclusions. In machine learning, this sensitivity means that outliers can disproportionately affect the predictive accuracy and reliability of the model.
Multicollinearity
In multiple linear regression models, highly correlated independent variables can distort the results, a phenomenon known as multicollinearity. For example, the number of bedrooms in a house and its size might be highly correlated since larger houses tend to have more bedrooms. This can make it difficult to determine the individual impact of individual variables on housing prices, leading to unreliable results.
Assuming a constant error spread
Linear regression assumes that the differences between the observed and predicted values (the error spread) are the same for all independent variables. If this is not true, the predictions generated by the model may be unreliable. In supervised machine learning, failing to address the error spread can cause the model to generate biased and inefficient estimates, reducing its overall effectiveness.